Point Cloud Classification - Part 2: Powerline Classification
< Previous section Next section >
Goal
In this section of the tutorial you will learn how to refine the point cloud classification from the previous section by classifying powerlines and pylons:
Tutorial Structure
- Perform powerline classification
- Cluster powerline points for filtering
- Calculate powerline cluster lengths for filtering
- Filter powerline clusters by minimum length
- Relabel powerline classification
- Perform pylon classification
Take care that you have finished the previous tutorial section (basic classification)! In this tutorial we will need the point cloud with the basic classification and attributes computed in part 1!
Powerline Classification
The example dataset includes powerlines that have to be separated from the building and vegetation classes.
To do so, open the tool LIS Pro 3D > Classification > Power Line Classification
- Provide the las_subset_tiles dataset.
- Provide the classid_facades_roofs attribute from the previous step as Classification.
- Set the Attribute Suffix for the output attribute to pl.
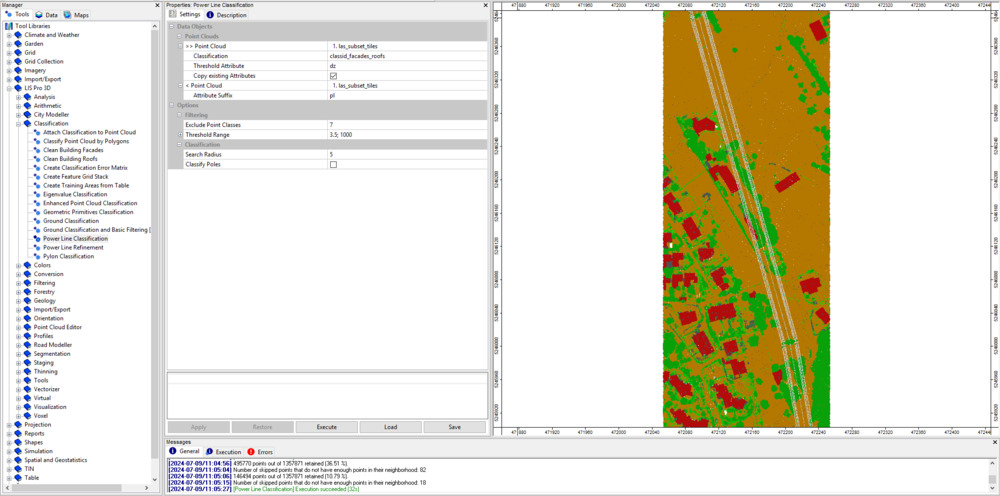
Use the following settings:
Tool: Power Line Classification
Geoprocessing: LIS Pro 3D → Classification // Tools → LIS Pro 3D → Classification
| Parameter | Setting |
|---|---|
| >> Point Cloud | las_subset_tiles |
| Classification | classid_facades_roofs |
| Threshold Attribute | dz |
| Copy existing Attributes | 🗹 |
| < Point Cloud | <not set> |
| Attribute Suffix | pl |
| Filtering | |
| Exclude Point Classes | 7 |
| Threshold Range | 3.5;1000 |
| Classification | |
| Search Radius | 5 |
| Classify Poles | ☐ |
Click Execute
After execution has finished, the map view should be updated and show the new classid_pl attribute. This classification now includes the powerlines as a separate class.
Clustering of Powerline Points for Filtering
In order to clean the result, the classified powerline points have to be clustered into different strings.
Open the tool Density-based spatial Clustering
- Provide the las_subset_tiles dataset.
- Provide the classid_pl attribute from the previous step as Constraint.
- Set the Attribute Range for the constraint attribute to 14;14.
- Set the Attribute Suffix for the output attribute to pl.
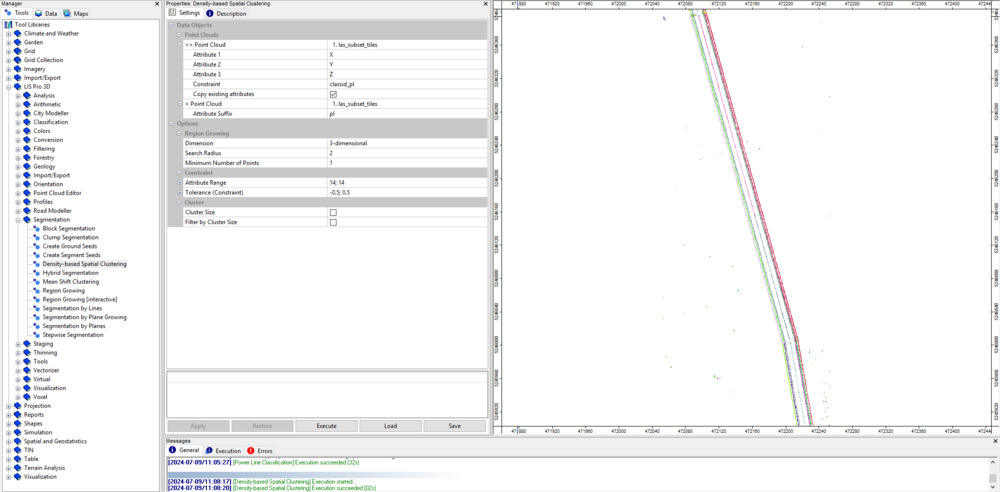
Use the following settings:
Tool: Density-based Spatial Clustering
Geoprocessing: LIS Pro 3D → Segmentation // Tools → LIS Pro 3D → Segmentation
| Parameter | Setting |
|---|---|
| >> Point Cloud | las_subset_tiles |
| Attribute 1 | X |
| Attribute 2 | Y |
| Attribute 3 | Z |
| Constraint | classid_pl |
| Copy existing attributes | 🗹 |
| < Point Cloud | <not set> |
| Attribute Suffix | pl |
| Region Growing | |
| Dimension | 3-dimensional |
| Search Radius | 2 |
| Minimum Number of Points | 1 |
| Constraint | |
| Attribute Range | 14;14 |
| Tolerance (Constraint) | -0.5;0.5 |
| Cluster | |
| Cluster Size | ☐ |
| Filter by Cluster Size | ☐ |
Click Execute
After execution, the map view should update again, showing the new cluster_pl attribute. This segmentation has the powerline strings in a separate class.
Cleaning of Powerline Classification
Calculate Powerline Cluster Lengths for Filtering
This step will calculate the lengths of individual powerline clusters and will help, to filter out misclassifications in the next step. To do so, open the tool Segment Features
- Provide the las_subset_tiles dataset.
- Provide the cluster_pl attribute from the previous step as Segment ID.
- Check the Length 2d.
- Keep all other choices unchecked.
- Set the Maximum Edge Length to 1.5.
Tool: Segment Features
Geoprocessing: LIS Pro 3D → Analysis → Features // Tools → LIS Pro 3D → Analysis
| Parameter | Setting |
|---|---|
| >> Point Cloud | las_subset_tiles |
| Segment ID | cluster_pl |
| Direction Scanner (X) | <not set> |
| Copy existing Attributes | 🗹 |
| < Point Cloud Features | <not set> |
| Attribute Suffix | |
| Geometric Features | |
| Point Count | ☐ |
| Length 2D | 🗹 |
| Length 3D | ☐ |
| … | … |
Click Execute
After execution the point cloud has got a new length2d attribute, indicating the length of a detected cable string.
Filter Powerline Clusters by Minimum Length
This step allows us to further filter out misclassifications (points that have erroneously been assigned to the powerline class), such as small branches of vegetation that appeared as linear structures. Open the tool Attribute Filter
- Provide the las_subset_tiles dataset.
- Provide the length2d attribute from the previous step as Attribute 1.
- Set the Filter Type to lower limit (min).
- Set the Minimum of the filter to 5.
- Set the Attribute Name to pl_filtered.
Tool: Attribute Filter
Geoprocessing: LIS Pro 3D → Filtering → Point Cloud // Tools → LIS Pro 3D → Filtering
| Parameter | Setting |
|---|---|
| >> Point Cloud | las_subset_tiles |
| Attribute 1 | length2d |
| Attribute 2 | <not set> |
| Attribute 3 | <not set> |
| Copy existing attributes | 🗹 |
| < Point Cloud | <not set> |
| Method | binary flag |
| Attribute 1 | |
| Filter Type | lower limit (min) |
| Minimum | 5 |
| Attribute 2 | |
| Attribute 3 | |
| Attribute Name | pl_filtered |
Click Execute
Relabel Powerline Classification
Now we can use the filtered line segments information in order to relabel the classification of powerline points, where the segment length was too small.
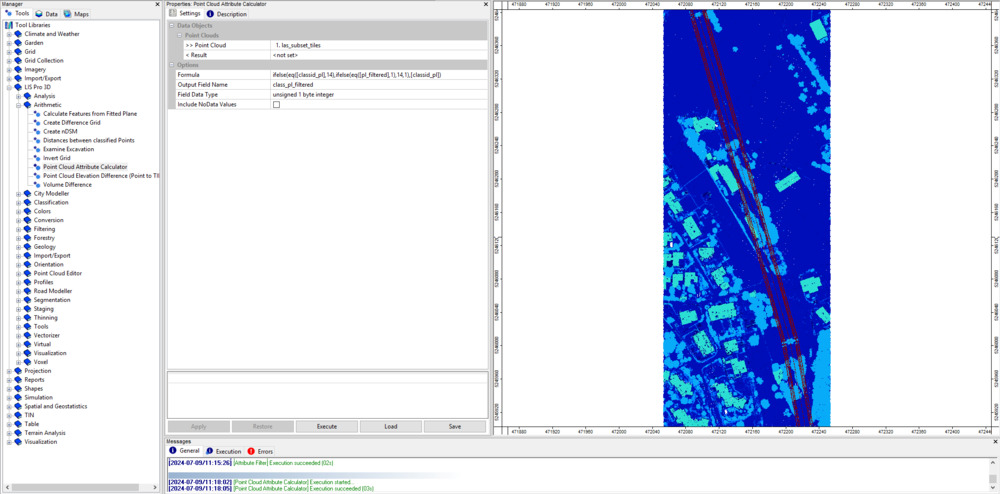
Open the tool LIS Pro 3D > Arithmetic > Point Cloud Attribute Calculator
- Provide the las_subset_tiles dataset
- Set the Output Field Name to classid_pl_filtered
- Set the Field Data Type to unsigned 1 byte integer
Use the following formula:
ifelse(eq([classid_pl], 14), ifelse(eq([pl_filtered], 1), 14, 1), [classid_pl])Tool: Point Cloud Attribute Calculator
Geoprocessing: LIS Pro 3D → Arithmetic → Point Cloud // Tools → LIS Pro 3D → Arithmetic
| Parameter | Setting |
|---|---|
| >> Point Cloud | las_subset_tiles |
| Result Field | <not set> |
| < Result | <not set> |
| Formula | ifelse(eq([classid_pl], 14), ifelse(eq([pl_filtered], 1), 14, 1), [classid_pl]) |
| Include NoData Values | ☐ |
| Output Field Name | class_pl_filtered |
| Field Data Type | unsigned 1 byte integer |
Click Execute
After execution the map view has updated again, showing the new classid_pl_filtered attribute.
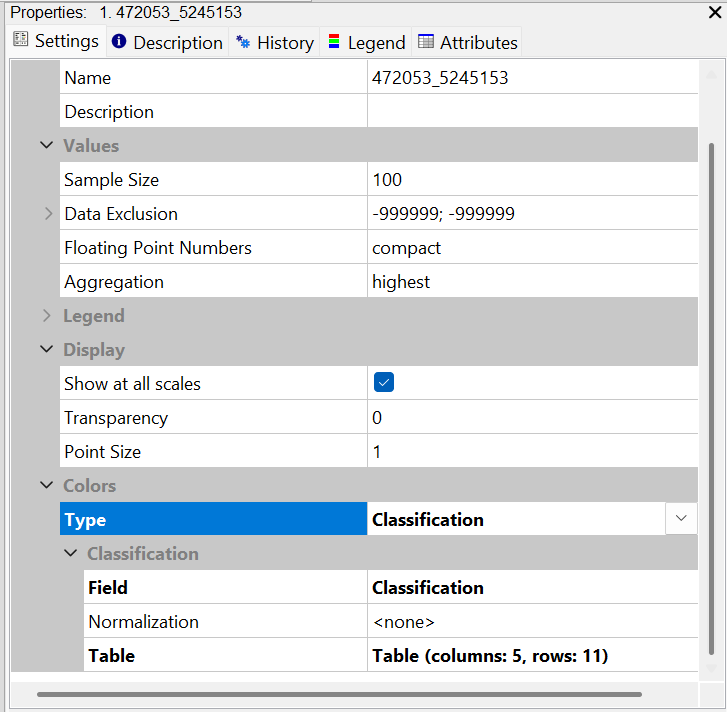
Set Color Scheme to “Classifcation”
In order to view the result, select the point cloud in the Data tab and in the Settings tab set Colors > Type to Classification.
Select the classid_pl_filtered attribute as Field.
Now, you should be able to view the current classification with the correct color scheme again:
Pylon Classification
As a last step, we will classify the pylons that hold the previously classified powerlines.
Open the tool LIS Pro 3D > Classification > Pylon Classification
- Provide the las_subset_tiles dataset.
- Provide the classid_pl_filtered attributes as Classification.
- Provide the dz attributes as DZ.
Use the following settings:
Tool: Pylon Classification
Geoprocessing: LIS Pro 3D → Classification // Tools → LIS Pro 3D → Classification
| Parameter | Setting |
|---|---|
| >> Point Cloud | las_subset_tiles |
| Classification | class_pl_filtered |
| DZ | dz |
| Copy existing Attributes | 🗹 |
| < Point Cloud | <not set> |
| Attribute Suffix | pylon |
| Minimum Pylon Height | 20 |
| Maximum Pylon Diameter | 25 |
| Search Radius | 3 |
| Maximum Difference | 2 |
| Minimum Number of Points | 200 |
| Seed Class | 14 |
| Exclude Point Classes | 7 |
| Output Calibration Information | ☐ |
Click Execute
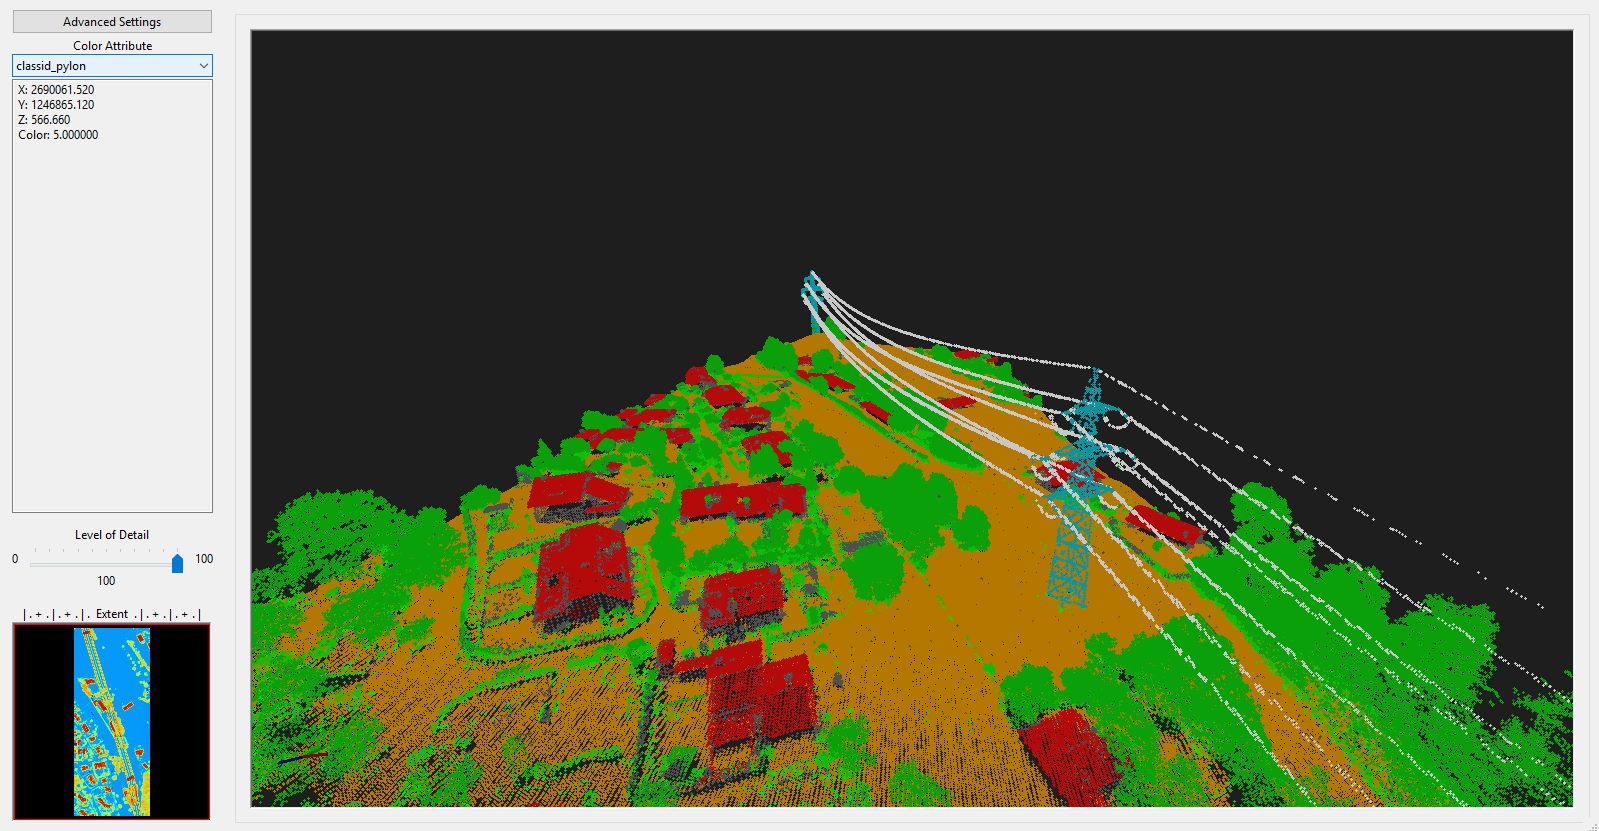
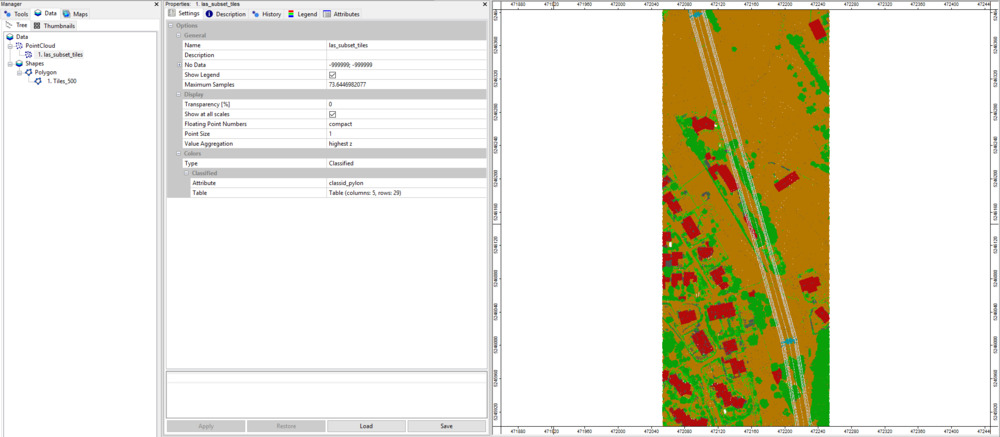
After execution the map view has updated again, showing the new classid_pylon attribute.
Inspect the Final Classification
Recap
In this section of the tutorial we have performed the following steps to classify powerlines and pylons:
- Perform powerline classification
- Cluster powerline points for filtering
- Calculate powerline cluster lengths for filtering
- Filter powerline clusters by minimum length
- Relabel powerline classification
- Perform pylon classification
The remaining section of this tutorial will show how you can automate the entire process by scripting LIS Pro 3D’s tools with Python and how to parallelize the workflow for fast and efficient processing!