Introduction to Automation with LIS Pro 3D
Automated Point Cloud Processing - a Typical Workflow
This section briefly outlines the ingredients for large scale automated point cloud processing.
1 Input Data Management
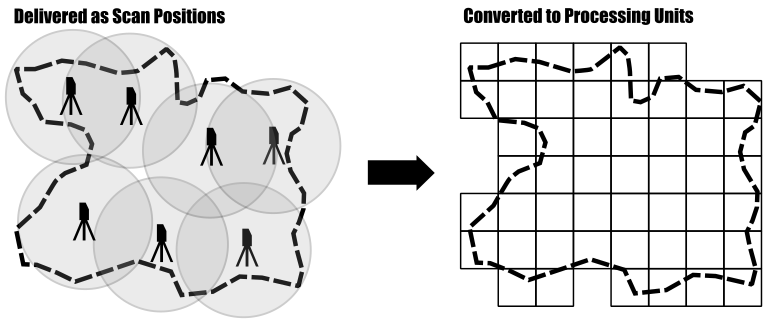
Suppose you have a point cloud dataset that covers a large region. This dataset likely consists of many individual tiles that cover the entire area of interest or a set of overlapping flight strips coming from the acquiring company. For terrestrial laserscanning you might have a set of overlapping individual scan positions at hand. For processing you need seemless access onto this data, allowing you to analyse all scan records together and apply your processing workflow across tile borders.
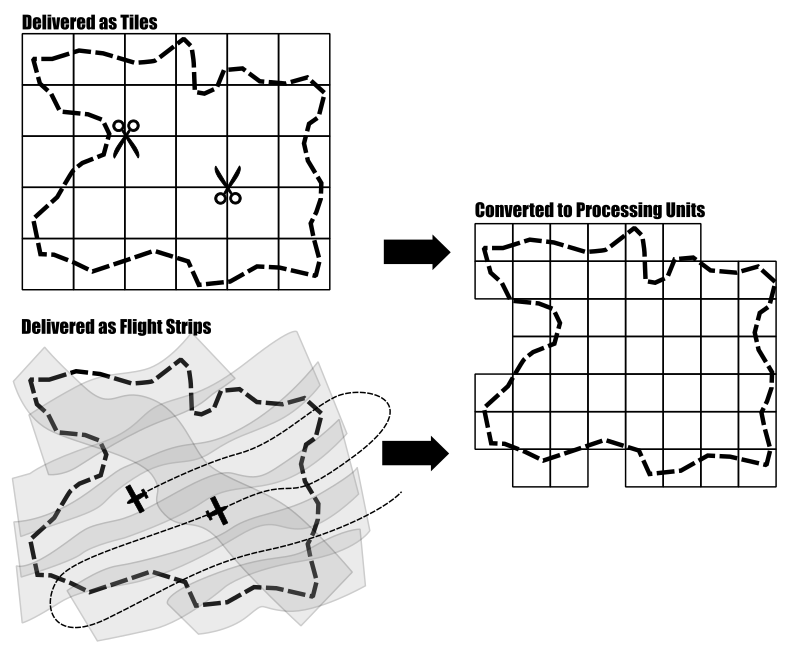
Loading the entire dataset (all flight strips, or all scan positions) into the memory of your computer in order to process everything at once is not recommended and for large area projects typically not possible. In such cases, you need to divide your dataset into smaller subsets (which we call processing units) and process these subsets, one step at a time.
LIS Pro 3D provides a set of mechanisms allowing the analysis of the data in chunks but without edge effects at the borders of the processing units.
Therefore, you first need to create a tiling scheme that is used for processing. Please note that these processing units do not necessarily need to follow the original tiling scheme that your dataset was delivered in. Usually processing units are much smaller, with the size of a unit depending on the point density of your data.
2 Workflow Design
Since you want to apply the same operation (e.g., classify a point cloud, derive elevation-, building- or tree models from it) to all these smaller processing units, you need a way to automatically apply this operation to every unit. Our recommended way of doing so is to automate this via scripting LIS Pro 3D with Python, hence we need to setup Python with LIS Pro 3D. This step only needs to be completed once for your computer!

Once you have done this, you can start configuring your project (input and output paths, folder structure). Based on this you might need to prepare your raw data in order make it analysis-ready and finally design your processing workflow, which defines the operations to be applied to each processing unit of your point cloud dataset. You will learn how to set this all up in a python environment!
3 Optimization
An optional, but often desired step is parallelization of the processing workflow. Your computer or workstation likely has more than a single CPU core (in fact many!). Therefore each of these can be tasked with processing a single unit and this type of parallelization can speed up processing dramatically.
4 Data Delivery
Another optional, but often desired step is to deliver the output dataset in a specified tiling scheme. Again, this delivery tiling scheme does not need to necessarily match the tiling scheme used during processing or of your input data!
From Sequential to Parallel Processing
Sequential processing handles one task at a time, completing each unit before moving to the next. While simple and easy to manage, this approach becomes increasingly slow as datasets grow larger. Parallel processing improves performance by dividing the workload across multiple processing units that operate simultaneously. Instead of processing units one after another, several units can be processed at the same time, dramatically reducing total runtime and making better use of modern multi-core CPUs. This shift toward parallelism is essential in data-intensive workflows such as terrain analysis and point cloud processing, where processing speed and scalability are critical.
Sequential Processing
Regular sequential processing of one unit after another.
Parallel Processing
Parallel processing of five units at a time. In practice, the number of units that can be processed concurrently is typically limited by the number of available CPU cores. Note that parallel execution does not require all five processes to start or finish at exactly the same time, even though the schematic representation here may suggest perfectly synchronized execution. Likewise, the processing units may be processed in any order and not necessarily row-wise, from top-to-bottom, as illustrated here.
Avoiding Edge Effects
A common concern when introducing tile-by-tile processing — whether executed sequentially or in parallel — is the occurrence of edge effects in the resulting datasets. Many spatial analysis algorithms rely on information from the surrounding spatial neighborhood. Examples include ground/non-ground classification, filtering operations, interpolation, and terrain analysis.
If each processing unit were analyzed strictly within its own spatial extent, features located near tile boundaries could be processed differently in adjacent tiles, leading to visible discontinuities or inconsistencies at tile borders.
To avoid these edge effects, each processing unit is processed together with an additional user-defined buffer zone surrounding the actual tile extent. The analysis is therefore performed on an enlarged spatial region that provides sufficient contextual information for the processing algorithms.
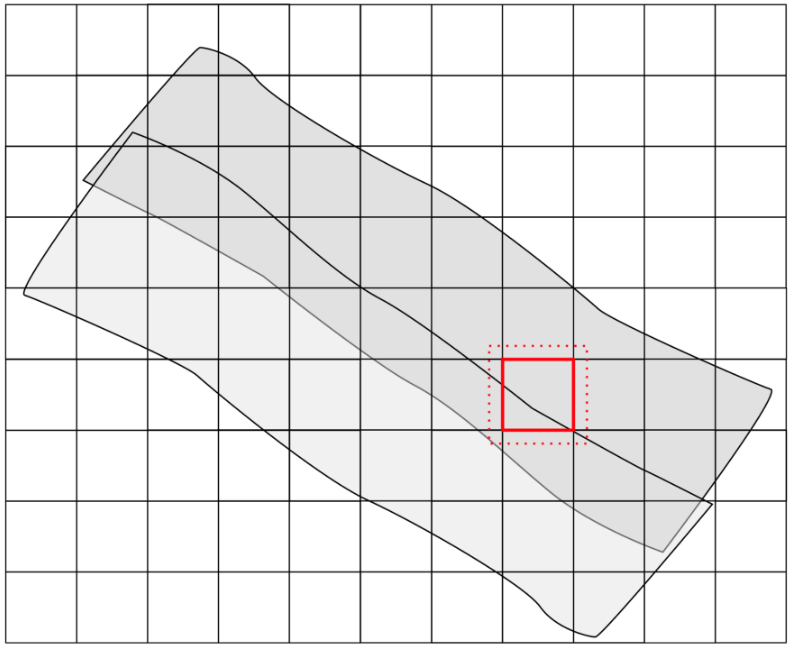
After processing has been completed, the buffered region is clipped away and only the original tile extent — conforming to the tiling scheme — is written to disk. When this procedure is applied consistently to all processing units, seamless results can be achieved across tile boundaries.
The required buffer size depends on the specific analysis or processing step being performed. Algorithms that rely on larger spatial neighborhoods generally require larger buffer regions.
In the following tutorials, you will learn how to create buffered processing extents and how to clip the buffered outputs using Python scripting.
In Short
Setup LIS Pro 3D with Python - only needs to be done once!
For Each Project
- Create tiling scheme
- Define project configuration
- Write processing script
- (Optional) Parallelize processing
- (Optional) Process output for data delivery
Concrete Example
In this tutorial, we will illustrate the workflow on a few tiles of point cloud data from the Canton of Zurich, Switzerland. Since we only want to introduce the general concept of setting up the workflow, we will only derive a Digital Surface Model (DSM) from the dataset. We will use this example to illustrate the concept of tile-wise processing and parallelization.