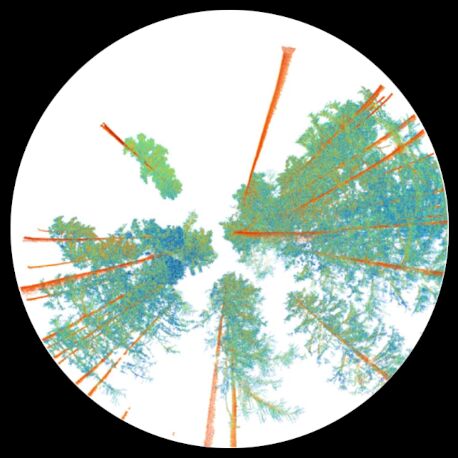

LIS Visualization
LIS Visualization provides tools for creating 2D visualisations directly from point cloud data. The package supports orthographic and perspective projections as well as different rendering and shading approaches to highlight the geometry and structure of the captured scene. Typical applications include creating map-like views and high-resolution illustrations of LiDAR datasets, visualising buildings, terrain and vegetation, generating perspective views for reports and presentations, and producing specialised visualisations that make otherwise difficult-to-interpret 3D structures more accessible.
Tool: Analytical Hillshading
| Features |
|---|
| • calculation of an analytical hillshading based on pre-computed point normals |
| Applications |
|---|
| • shading of a point cloud |
Tool: Colorize Point Cloud by Morphology
| Features |
|---|
| • attachment of a morphological shading (based on topographic openness and slope) as RGB values to a point cloud |
| • calculation of point normals, optional |
| Applications |
|---|
| • morphological shading of a point cloud |
Tool: Colorize Virtual Point Cloud by Morphology
| Features |
|---|
| • attachment of a morphological shading (based on topographic openness and slope) as RGB values to a point cloud |
| • calculation of point normals, optional |
| • automated subset extraction from a virtual point cloud based on a polygon shapes layer |
| Applications |
|---|
| • morphological shading of point cloud subsets |
Tool: Direction Vectors
| Features |
|---|
| • creation of direction vector line representations from 2D and 3D vector point cloud attributes |
| • various vector length options (original length, scaled, fixed) |
| • various styling options (simple line, simple line - centered to point, arrow, arrow - centered to point) |
| Applications |
|---|
| • construction of line representations of direction vectors for visualization in 2D or 3D |
| • cartographic visualization of (movement) directions |
Tool: Point Cloud Orthoimager
| Features |
|---|
| • orthoimage (orthorectified raster) creation from all points detected within a user specified range to a profile line |
| • profile line (x-axis of the image) is defined by a line shapes layer or by coordinates |
| • AOI is aligned left or right to the profile line, or centered on the profile line |
| • gridding of a user specified attribute |
| • additional output: depth image (range) |
| Applications |
|---|
| • orthoimage creation from, e.g., terrestrial point cloud data |
| • distance measurements in the output image |
| • point cloud visualization |
Tool: Point Cloud Orthoimager [interactive]
| Features |
|---|
| • orthoimage (orthorectified raster) creation from all points detected within a user specified range to a profile line |
| • profile line is interactively digitized in a Map View |
| • AOI is aligned left or right to the profile line, or centered on the profile line |
| • gridding of a user specified attribute |
| • additional output: depth image (range) |
| Applications |
|---|
| • orthoimage creation from, e.g., terrestrial point cloud data |
| • distance measurements in the output image |
| • point cloud visualization |
Tool: Point Cloud Photographer
| Features |
|---|
| • image creation from point clouds by modelling a camera pose, focal length and camera sensor |
| • lense types: tele, panorama, or hemisphere |
| • adjustable focal length and sensor size |
| Applications |
|---|
| • image creation from point clouds |
| • reproduction of photographs |
| • creation of virtual hemispherical images (VHI) |
| • point cloud visualization |
Tool: Shading Normals
| Features |
|---|
| • computation of normal vectors describing the surface orientation at each point |
| Applications |
|---|
| • normal vector computation for normal-based shading e.g. in the '3D Point Cloud Viewer' |