
LIS Profiles
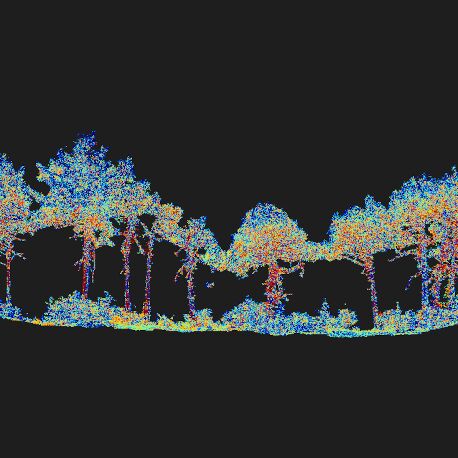
LIS Profiles provides tools for extracting, analysing and visualising cross-sections and transects from point clouds, raster datasets and vector data. Profiles can combine information from multiple datasets and be interactively inspected, measured and exported. Typical applications include examining terrain cross-sections, comparing point cloud elevations against a DTM, analysing changes between surfaces acquired at different times, measuring building heights, and checking vertical clearances between high-voltage power lines and the terrain.
Tool: Profile Plotter
| Features |
|---|
| • generation of profile plots from a table or shapes layer |
| • profile is output as point and line shapes layers |
| • zooming, panning, and measurement of distances |
| • user-defined colorization |
| Applications |
|---|
| • creation of plots from transects queried from point clouds, grids or shapes layers |
| • measurement of, e.g., building heights or the interspace between high-voltage power lines and the terrain |
Tool: Profile from Contour Shapes
| Features |
|---|
| • generation of transects from both 2D and 3D contour line shapes layers |
| • profile line can be provided by line shapes layer |
| • output as 3D point shapes layer |
| Applications |
|---|
| • generation of transects |
Tool: Profile from Grids
| Features |
|---|
| • query of transects from one or more grid data sets |
| • optionally together with a point cloud |
| • profile line(s) can be provided as line shapes layer, coordinate list, or start/end coordinates |
| • flipping of the profile direction, optional |
| • splitting of the profile into two parts (negative/positive), optional |
| • application of profile offset, optional |
| • vertical exaggeration, optional |
| • output as point/line shapes layer |
| Applications |
|---|
| • generation of transects / cross sections |
| • quality control (point cloud vs. grid) |
| • multitemporal change detection (grid stack) |
Tool: Profile from Grids [interactive]
| Features |
|---|
| • query of transects from one or more grid data sets |
| • optionally together with a point cloud |
| • profile line is digitized in a Map View |
| • vertical exaggeration, optional |
| • automatic generation of profile plots, optional |
| • output as point/line shapes layer |
| • digitized profile line is output as shapes layer |
| Applications |
|---|
| • generation of transects |
| • quality control (point cloud vs. grid) |
| • multitemporal change detection (grid stack) |
Tool: Profile from Point Cloud
| Features |
|---|
| • query of transects from a point cloud data set |
| • optionally together with a grid data set |
| • profile line can be provided as line shapes layer, coordinate list, or start/end coordinates |
| • width of the queried corridor can be specified |
| • flipping of the profile direction, optional |
| • splitting of profile into two parts (negative/positive), optional |
| • application of profile offset, optional |
| • vertical exaggeration, optional |
| • attachment point cloud attributes to the result, optional |
| • displacement between each point and the profile line is reported |
| • output as point shapes layer (point cloud is optional) |
| Applications |
|---|
| • generation of transects |
| • quality control (point cloud vs. grid) |
Tool: Profile from Point Cloud [interactive]
| Features |
|---|
| • query of transects from a point cloud data set |
| • optionally together with a grid data set |
| • profile line is digitized in a Map View |
| • width of the queried corridor can be specified |
| • vertical exaggeration, optional |
| • attachment of point cloud attributes to the result, optional |
| • displacement between each point and the profile line is reported |
| • output as point shapes layer (point cloud is optional) |
| • digitized profile line is output as shapes layer |
| Applications |
|---|
| • generation of transects |
| • quality control (point cloud vs. grid) |