In this tutorial, you will learn the basics of the LIS Pro 3D graphical user interface.

< previous tutorial … next tutorial >
Introduction
LIS Pro 3D has a graphical user interface, which allows convenient conduction of point cloud preparation, processing and analysis tasks. For small projects the LIS Pro 3D GUI is the way to go. For power users, processing large projects and automating workflows with python, the GUI is also an important option to start with. Before you start running large chellenging tasks it is advisable to try it out in the graphical user interface of LIS Pro 3D first. This speeds up the learning process compared to pure python development and gives a visual understanding of how all the tools work together to help solving a processing problem.
In the following, you will learn how to use the LIS Pro 3D graphical user interface for inspecting data.
Step 1: Create a new folder for your project
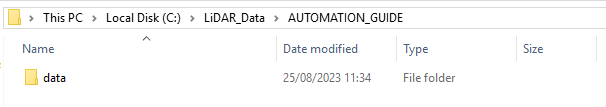
Step 2: Create a new folder for your input data
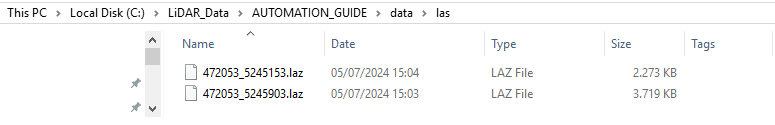
Create a folder data with the subfolder las and put your available input *.laz-files in it!
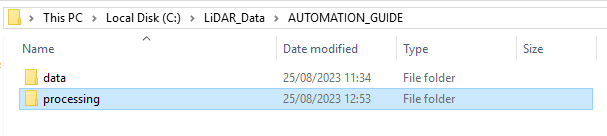
Step 3: Create a new processing folder
The folder where all your outputs will be saved
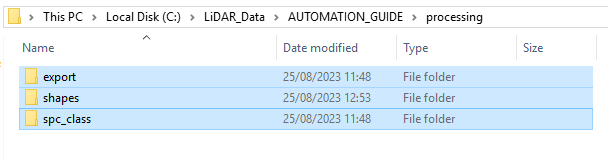
Step 4: Create your output folders
Within the processing folder, create the folder, where all your outputs will be saved! These folders are called:
- export (the folder for your final output)
- shapes (the folder for shapefiles describing the extent of your available data)
- spc_class (the folder for the classified output pointclouds)
Step 5: Open LIS Pro 3D Graphical User Interface
Find it in your installed programms. It is recommended to use a desktop shortcut.
If you open LIS Pro 3D for the first time, it will look similar to this:
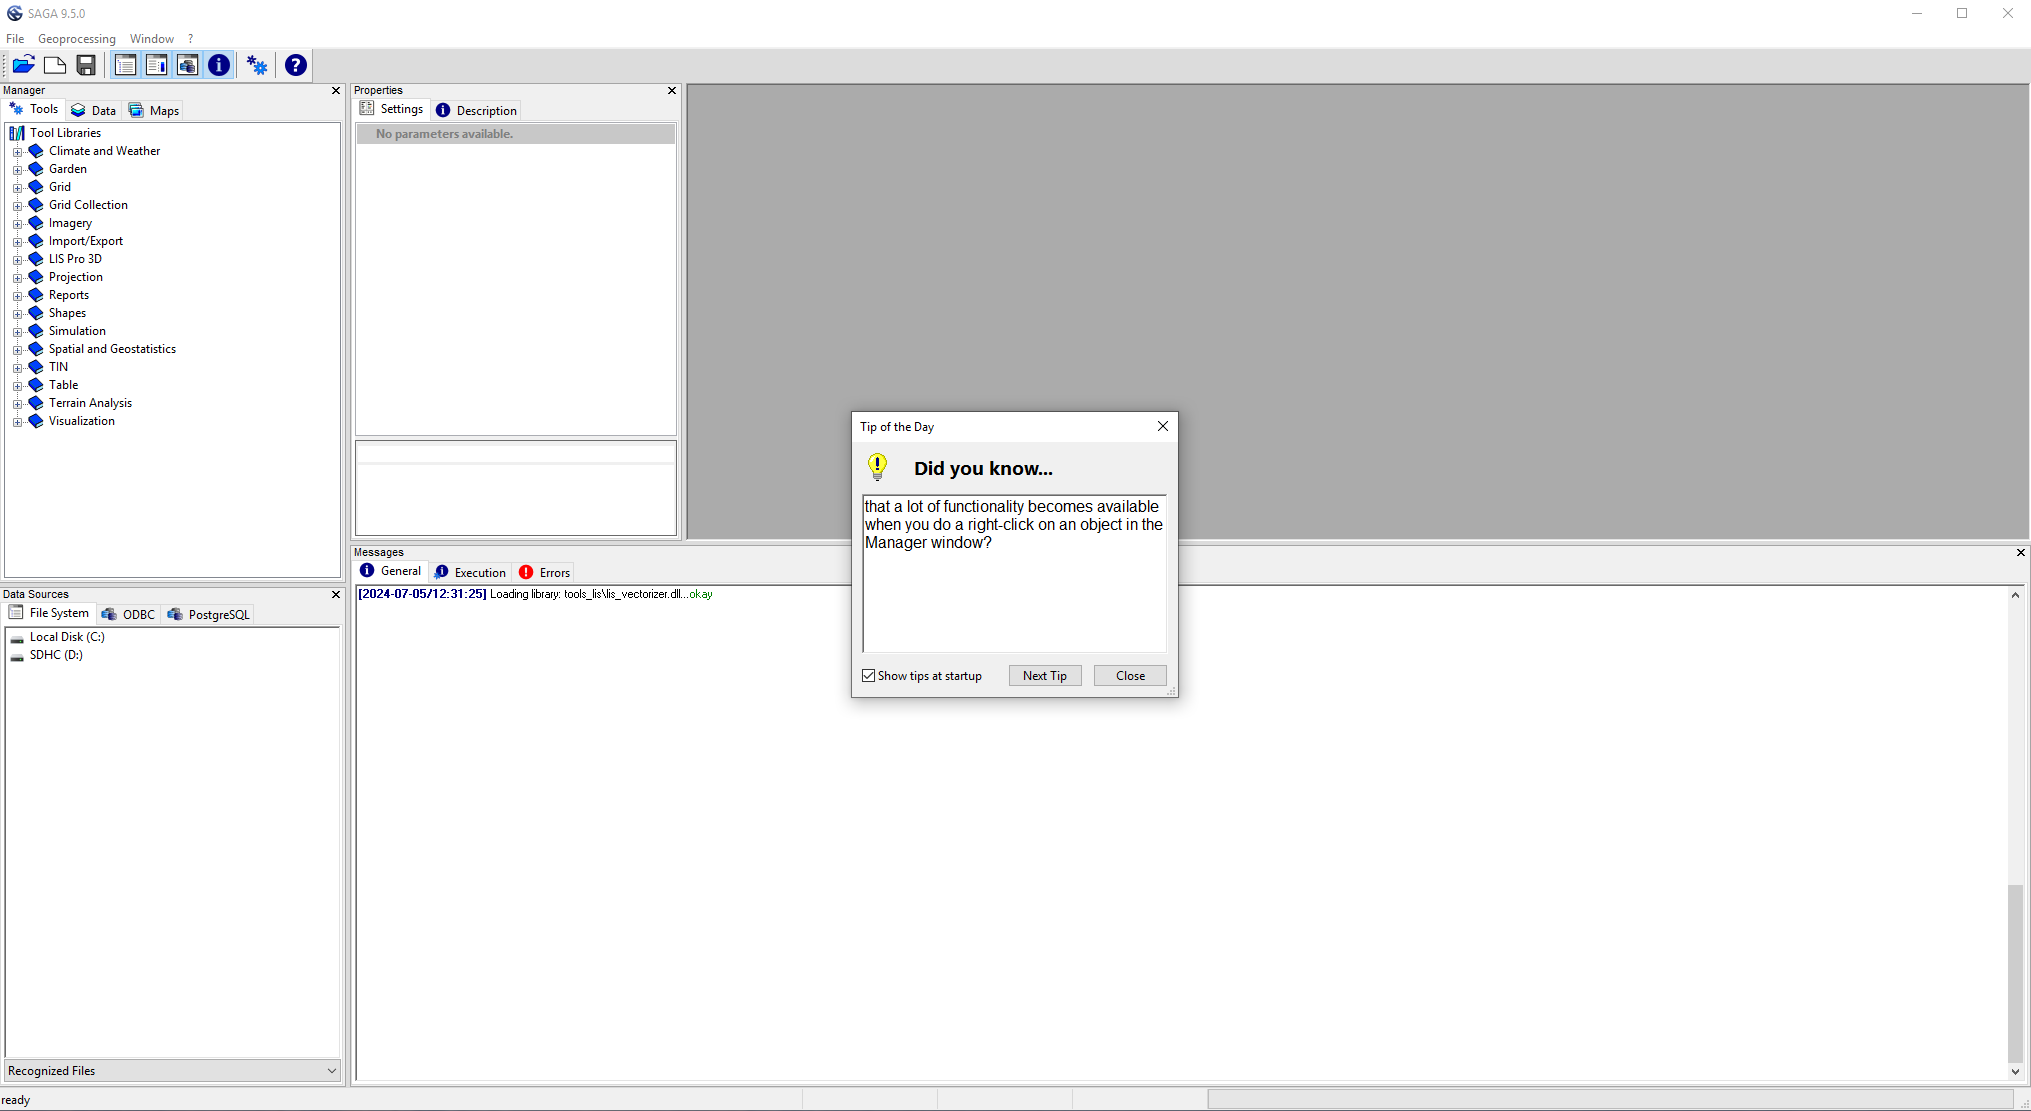
Close the Tip of the Day window!
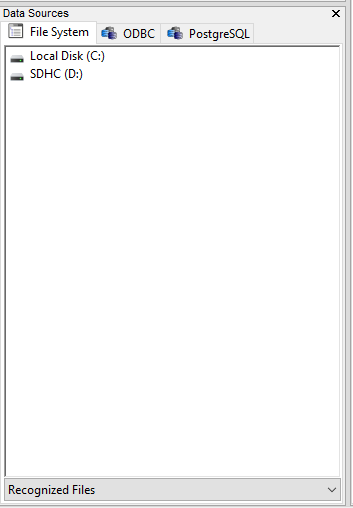
Close the Data Sources Window!
After this, the User Interface will look like this.
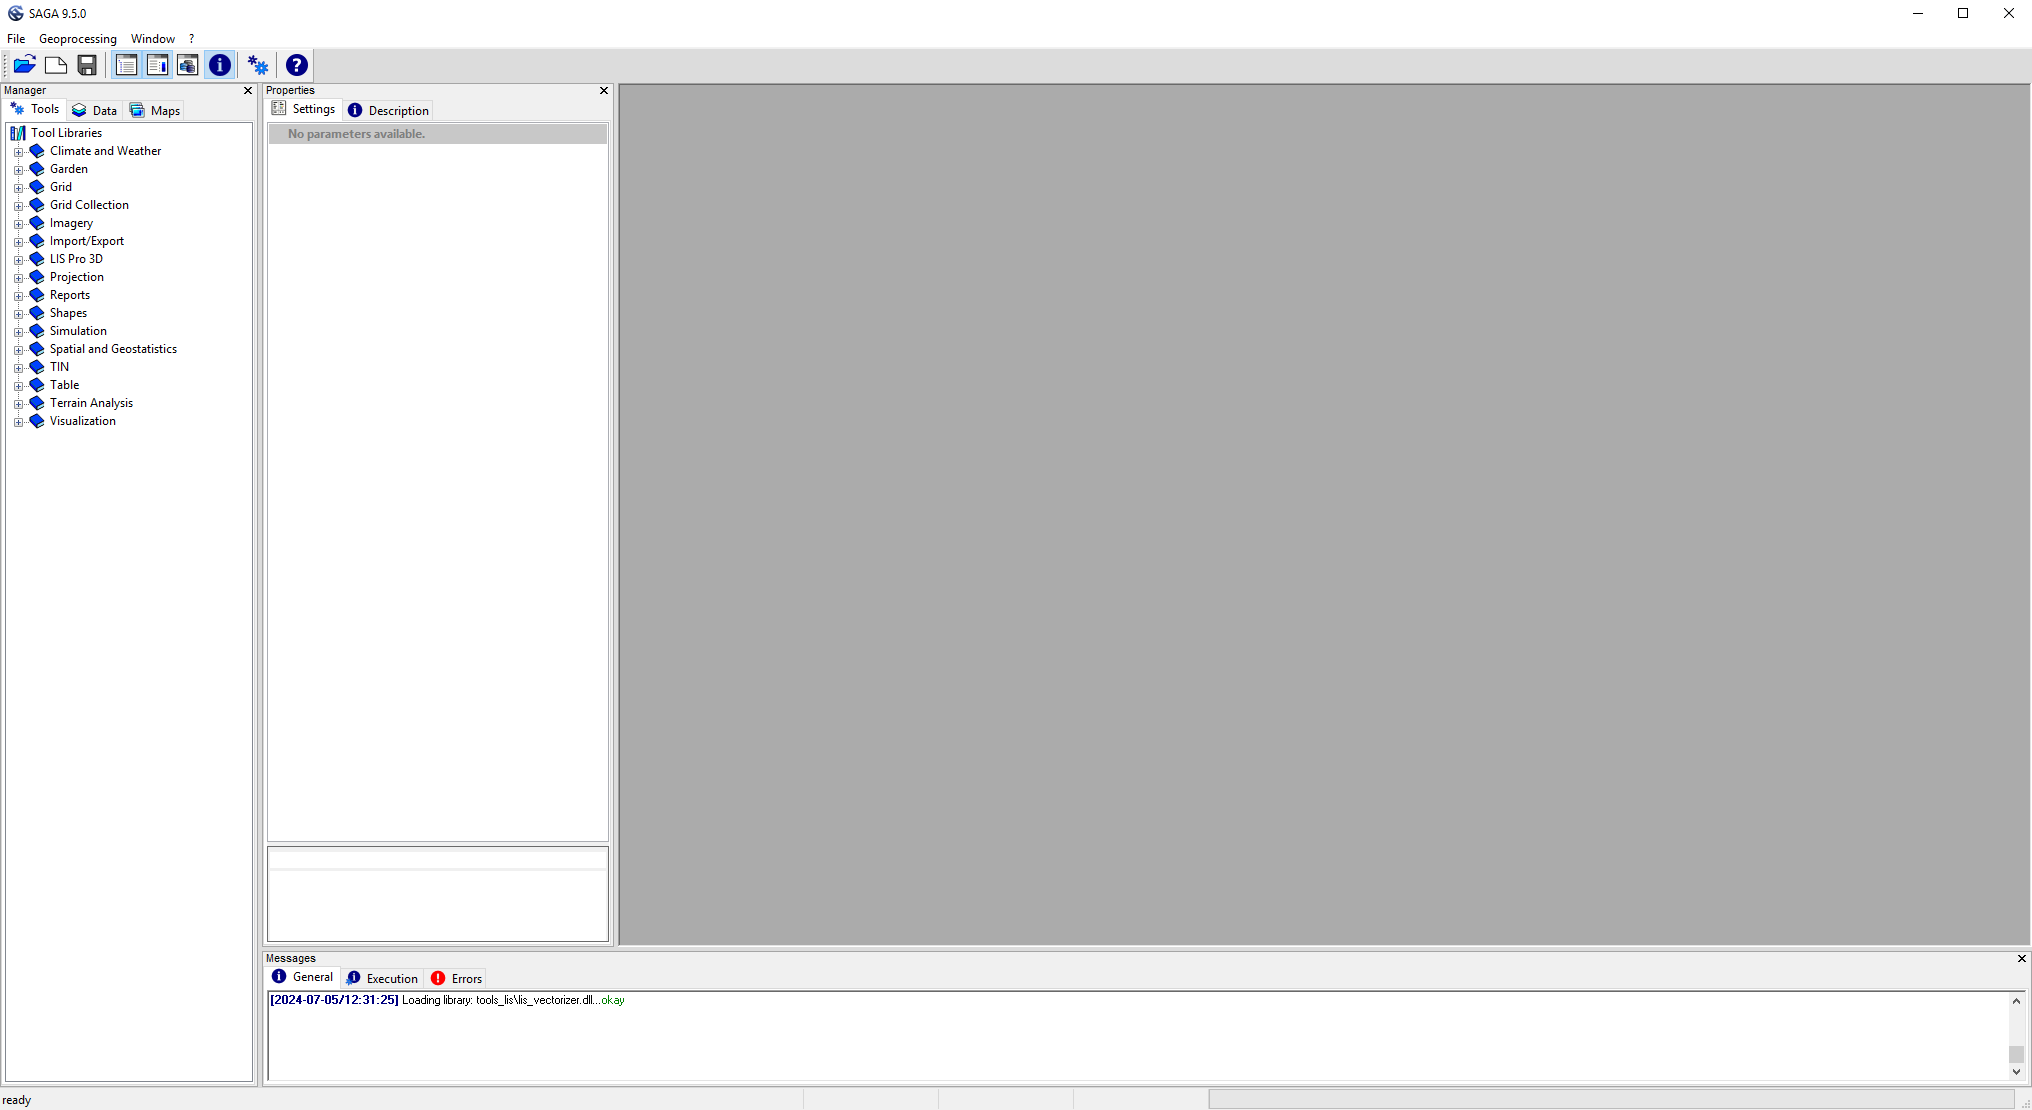
Step 6: Inspect the different windows of the GUI
You can see the Manager Window, Properties Window and the Messages Window.
Manager Window
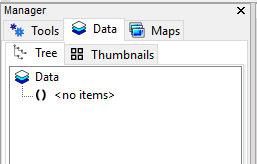
The Manager Window is the most important one and consists of 3 tabs (Tools, Data, Maps). As we have not loaded any data yet, the Data and Maps Tab are still empty.
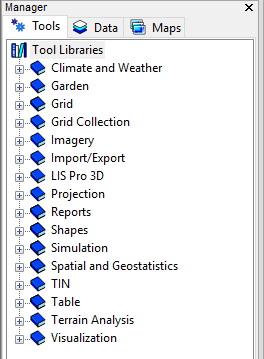
In the Tools tab you can see all the available tools, that you can use for building a workflow. One of these Libraries is LIS Pro 3D
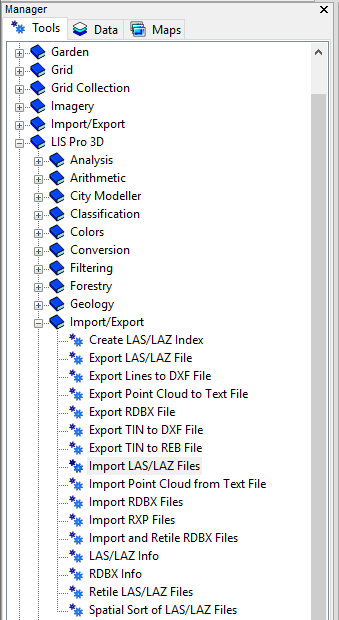
Within one tool library, you will find multiple specialized sub libraries. Within the sub libraries you will find specialized tools (here, a tool for importing *.laz-files)
Properties Window
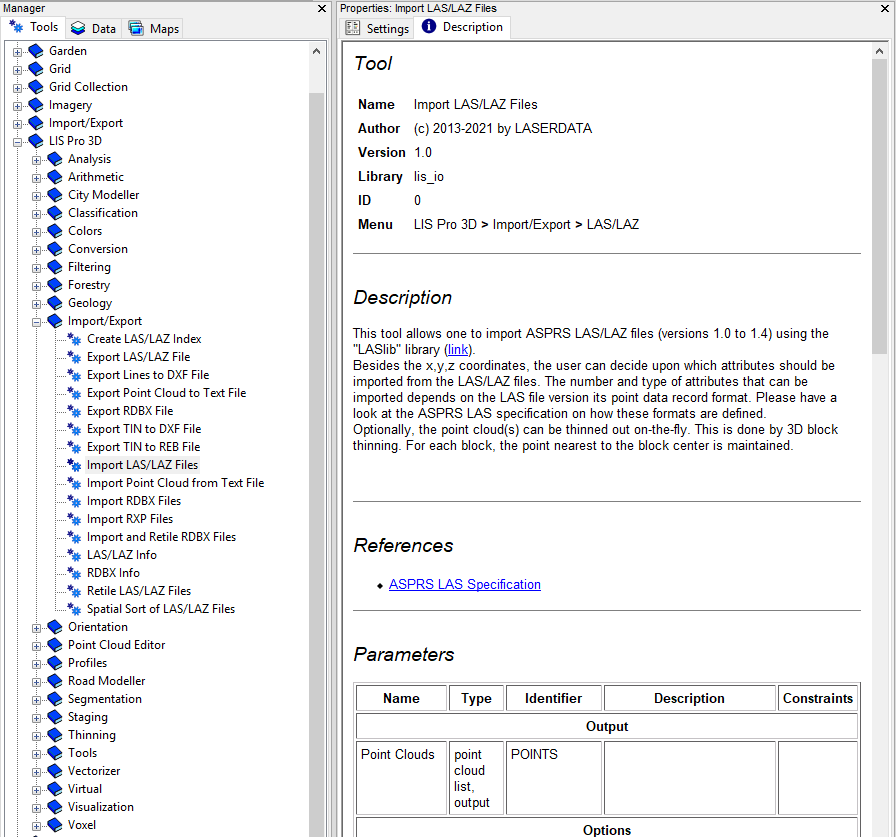
The Properties Window is linked to the Manager Window. If you select a tool or data set in the Manager Window you will see the Settings (Settings tab) or the Description (Description tab) for this selected tool.
See here the Description of the selected LAS/LAZ import tool.
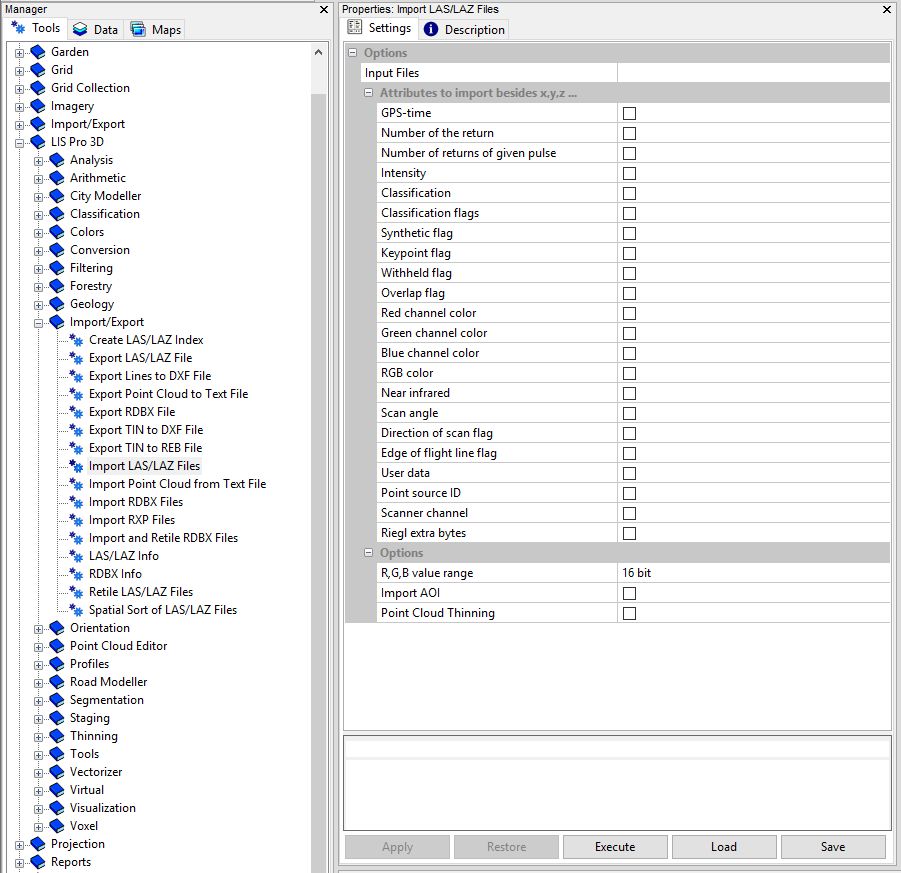
See here the Settings of the selected LAS/LAZ import tool.
Messages Window
The Messages Window prints messages, indicating if tool executions have been successful or not and how long the tool runs took.
Step 7: Import the available LAZ files
In the example we have two *.laz-files available that we can import and inspect (open geodata Canton Zurich, Switzerland, geoportal.zh.ch/opendata).
Let’s import the two *.laz-files using the tool: LIS Pro 3D > Import/Export > Import LAS/LAZ Files.
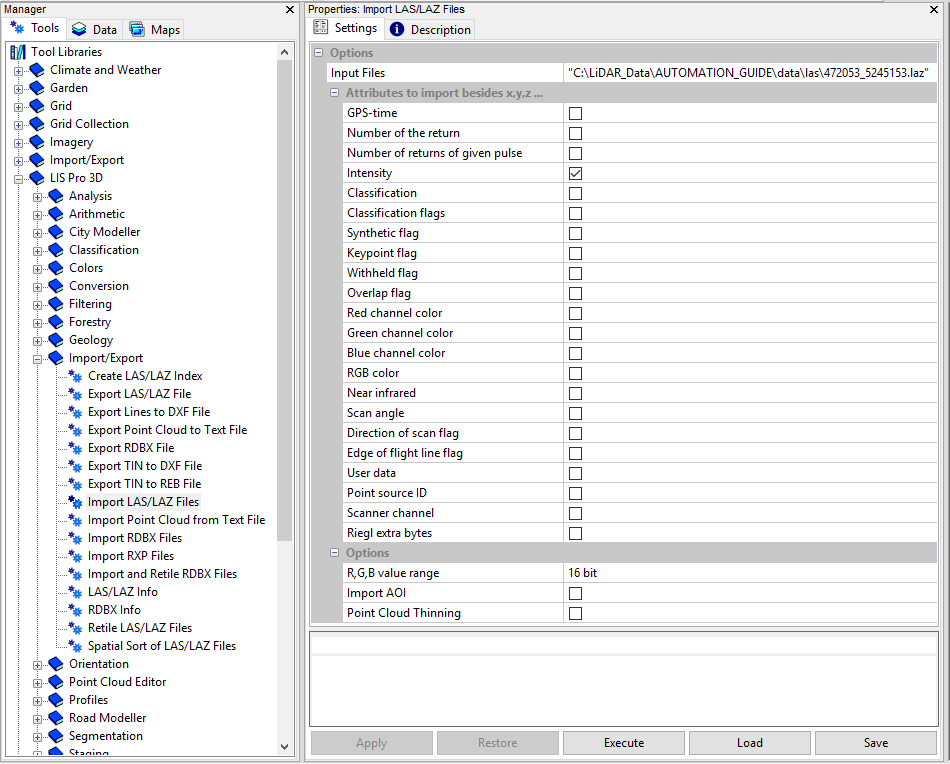
Use the browse button in order to find the Input files in your directory structure.
Choose some attributes (e.g. intensity) in order to add it to the x,y,z coordinates of the point cloud.
click Execute
Step 8: Inspect the available LAZ files
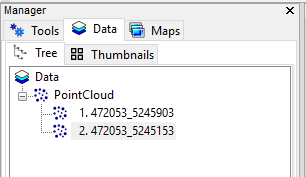
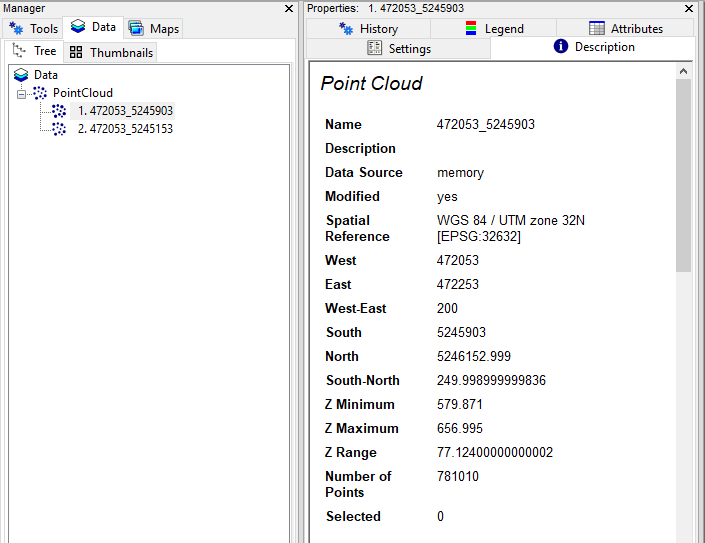
The imported files will appear in the Data Tab of the Manager Window.
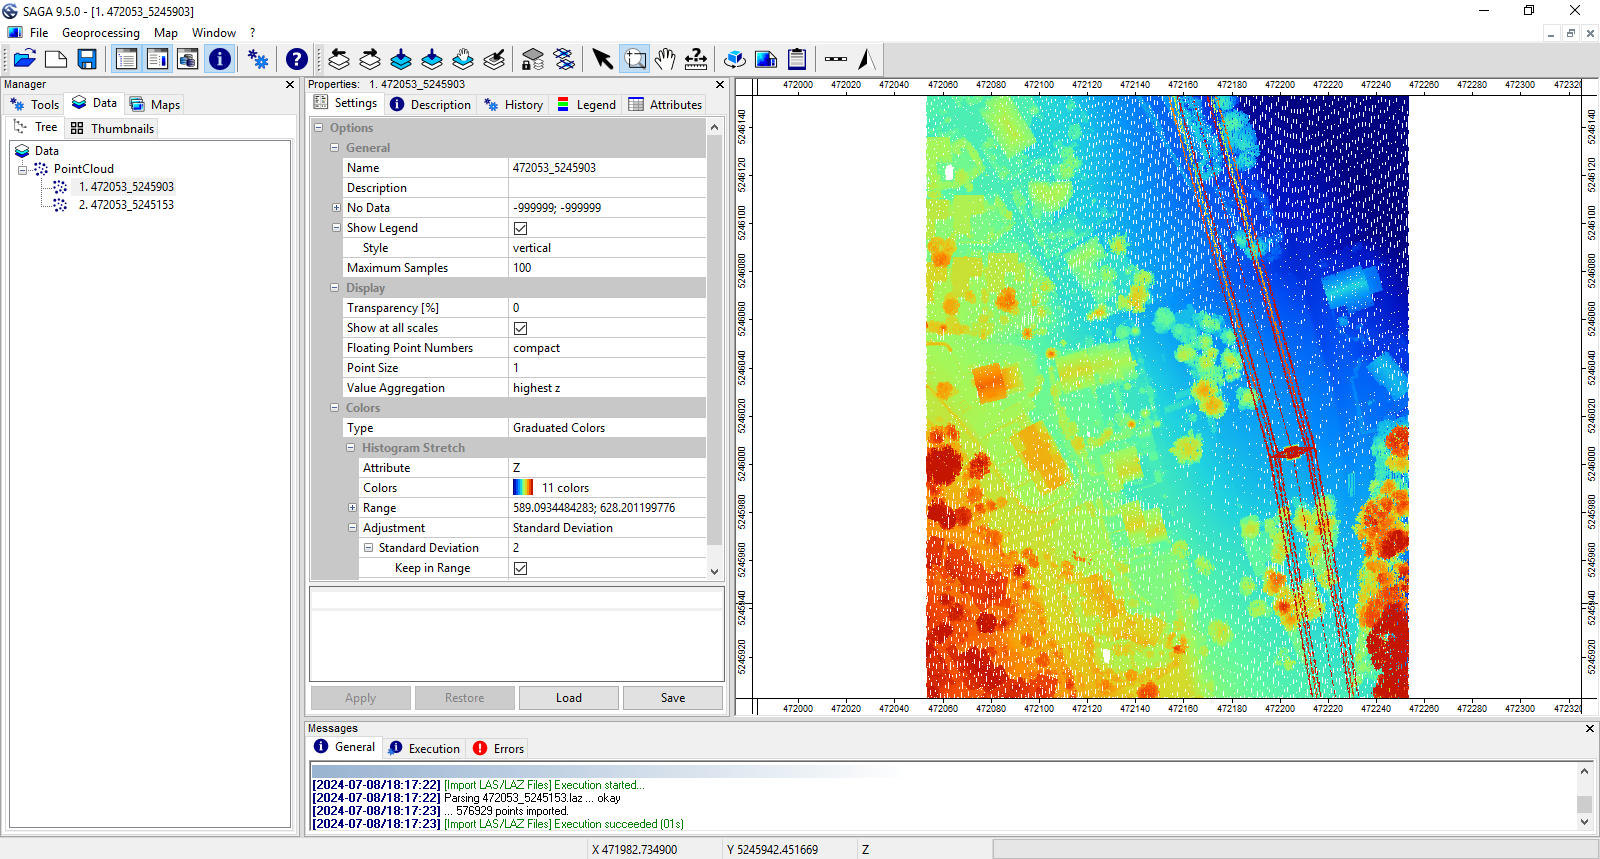
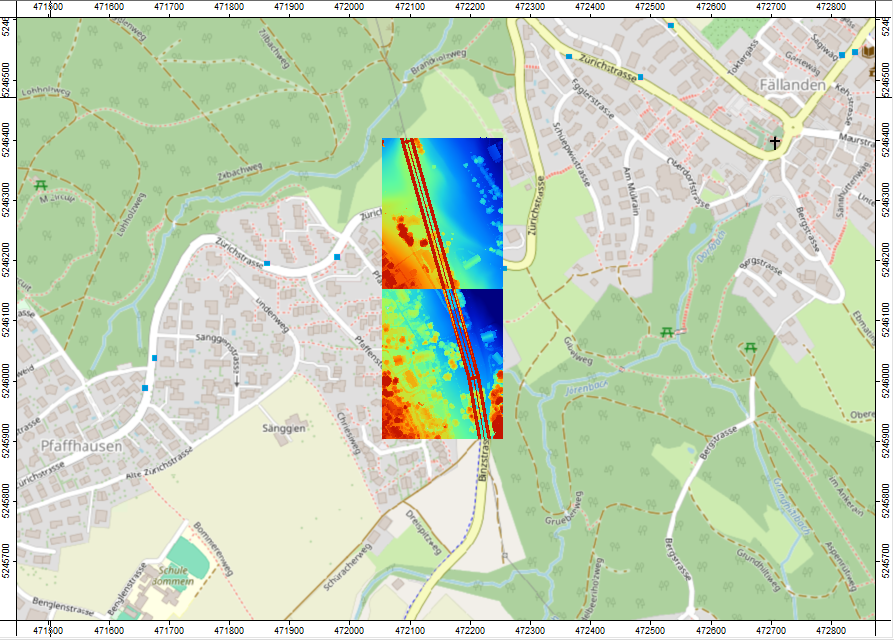
Double-clicking onto one of the datasets will open a map-view of the point cloud.
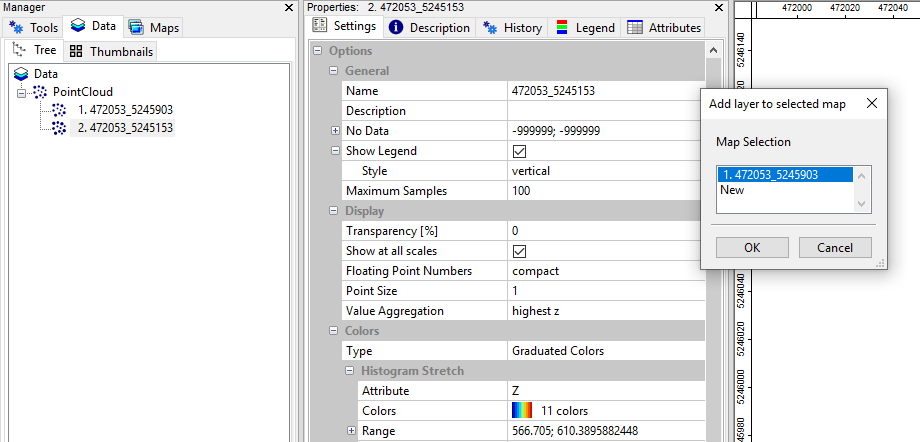
Double-click onto the second dataset and and add it to the existing map in the following popup (selected in blue here)
Use the Zoom tool (highlighted in blue) in order zoom out in the map.

- Zoom: Mouse Wheel (roll)
- Move: Mouse Wheel (hold and move)
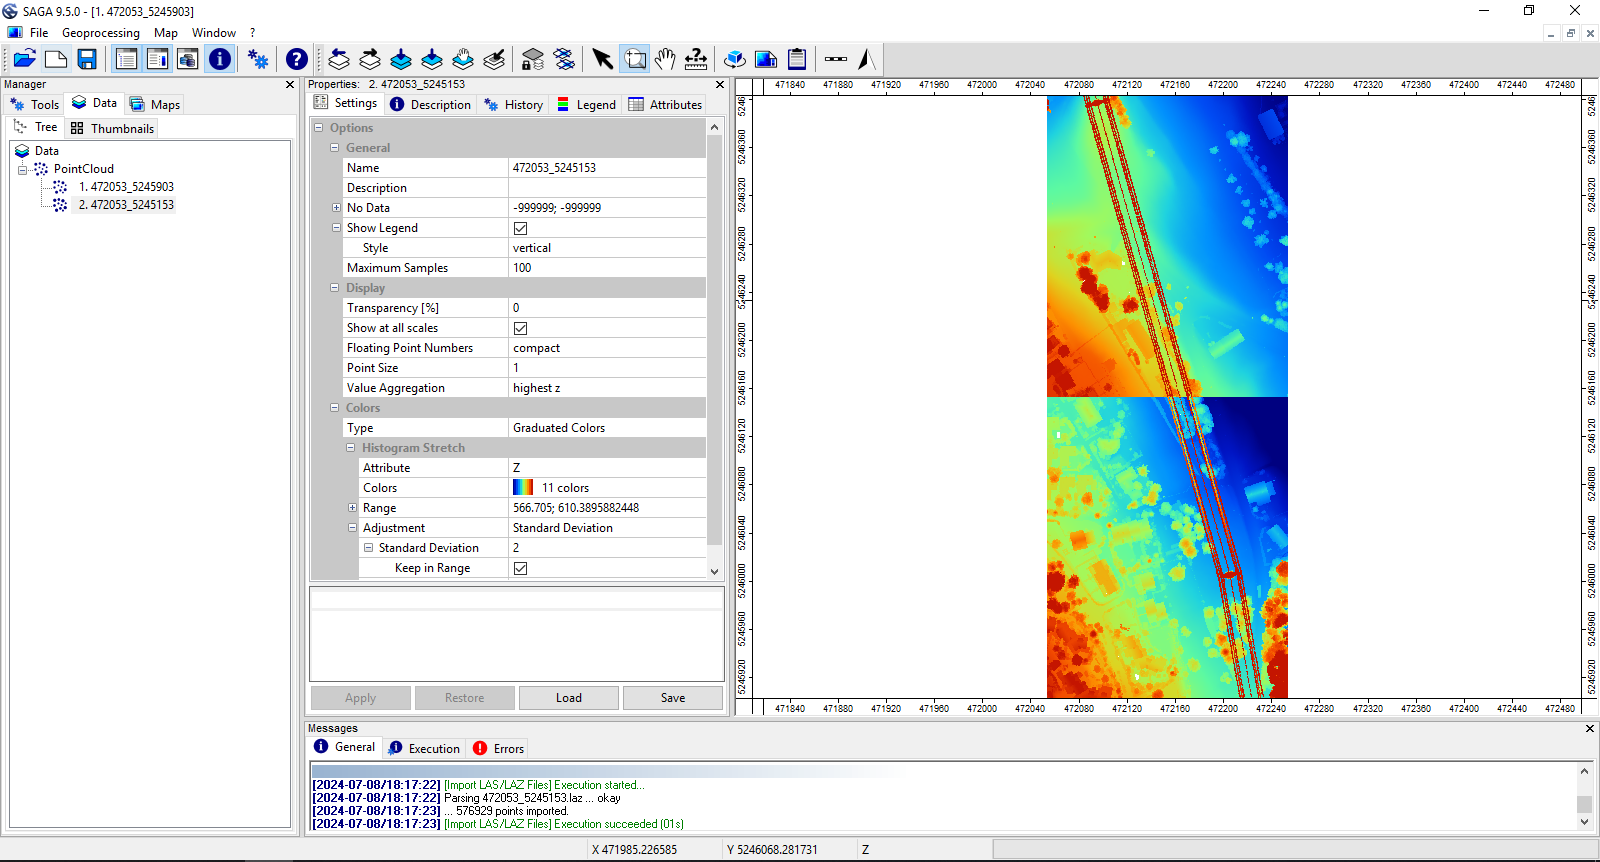
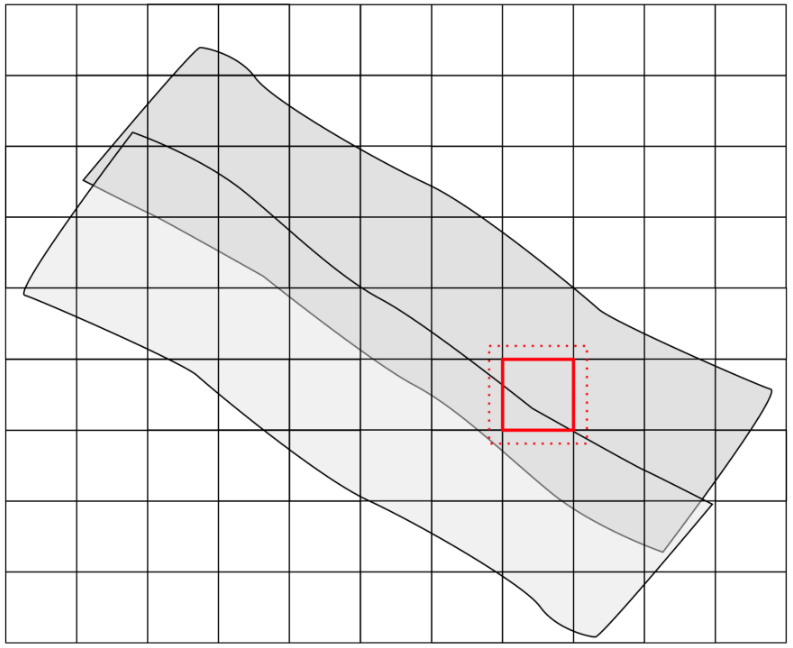
You can see, that we have two separated datasets. We can switch off and on the datasets in the Maps Tab of the Manager Window by clicking on it.
Step 9: Add a Basemap
We can add a basemap to our mapview in order to see where our data is located.
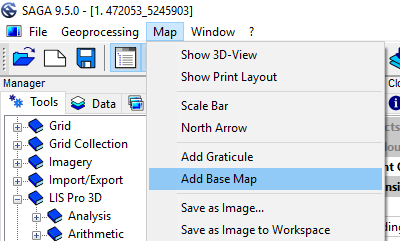
In the top menu you can click on Map > Add BaseMap and choose a layer as basemap (e.g. Open Street Map).
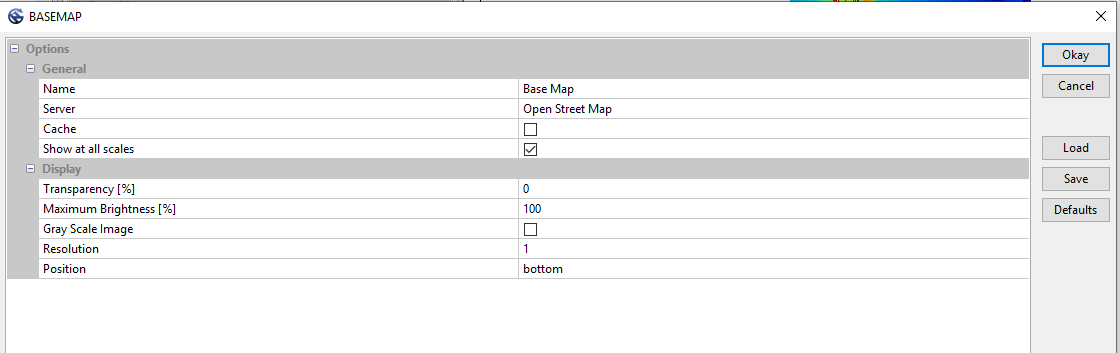
click okay!
In the Mapview a new background layer appears.
This is only working if the loaded layers have a correct projection (e.g. UTM 32N) assigned. The assigned projection can be reviewed by selecting the respective dataset and inspect the Spatial Reference in the Description Tab.
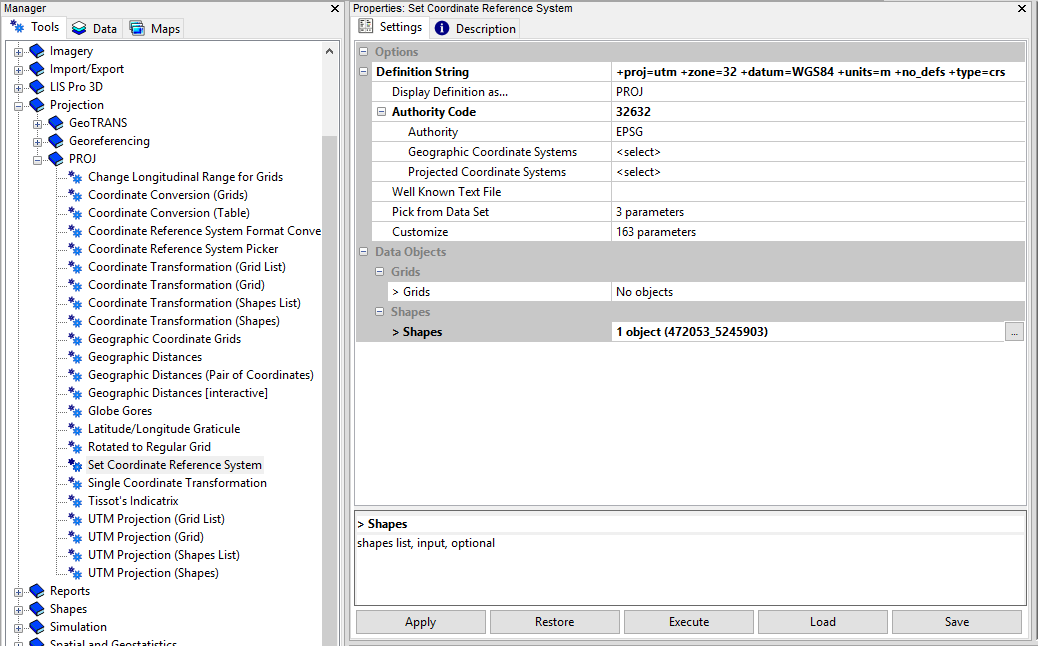
In case your dataset has no projection defined, you can set the projection manually using Projection > PROJ > Set Coordinate Reference System. Here you can e.g. use the EPSG Code or Proj4 String. Provide the point cloud as Shapes.
Step 10: Inspect the available LAZ files in 3D
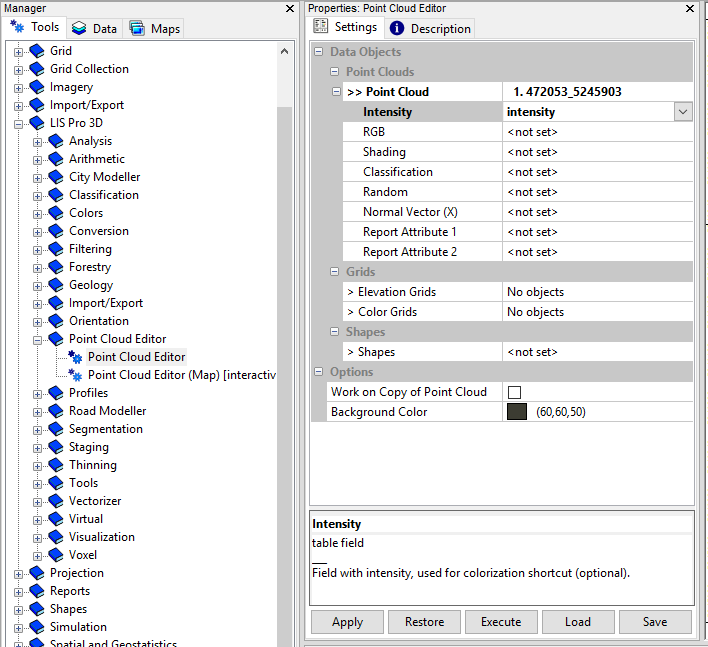
Use the tool LIS Pro 3D > Point Cloud Editor > Point Cloud Editor in order to view a dataset in 3D.
- provide a point cloud and attributes
- click Execute
The Point Cloud Editor opens:
rotate the point cloud with hold/drag left mouse
move the point cloud with hold/drag right mouse
zoom the point cloud with mouse wheel
select a subsection in the lower left window by dragging a rectangle with left mouse
select a profile in the lower left window by dragging a line with right mouse
switch to intensity coloring by typing the shortcut 2 on your keyboard.
increase/decrease the point size by typing the shortcut F6/F5 on your keyboard.
change transparency of points by typing the shortcut F12/F11 on your keyboard.
Close the Viewer again by clicking on the x in the up-right corner of your screen.
First Conclusions
We can import and inspect point clouds. However these point clouds are not connected. Having a number of separated point cloud files is a standard scenario in point cloud processing. Depending on your data you might have a bunch of overlapping scan positions or flight strips or you have already point cloud data that is split into tiles.
Having the data split up is useful to save computer memory but seems to complicate processing, where a large area has to be analysed all together.
In order to manage multiple point clouds conveniently, LIS Pro 3D uses point cloud catalogs for processing. Providing a python API it also has a flexible way for automating huge processing tasks.
How this is linked all together in LIS Pro 3D will be shown in the following tutorials. But first we will have a quick look into python coding in general. If you are already familiar with python, you can skip this section.